

- UpdateUpdate
Yesterday (February 18th) between 14:21 and 14:54 CET, the Accedo One API exhibited slower response times and at a certain point, returned errors for a subset of API calls being issued to the system. The triggering factor for the issue was a substantial load on the API, lasting between 13:39 and 14:54 CET in combination with several changes made in the Admin UI by editors in rapid succession in the organisations which caused the high traffic levels. These changes made to the underlying datasets evicted the cached data, letting through additional traffic to the underlying system. At 14:20 CET, one specific micro-service was overwhelmed when the data it was serving was repeatedly changed at the same time as the traffic suddenly burst through its previous high levels. This can be seen in the large anomaly in the purple line in the chart below starting at 14:20 CET, from which the traffic quickly went from 400 000 requests per minute (rpm), to above 1.1 million rpm in under 10 minutes. Note that timestamps in the graph are presented in **UTC**. 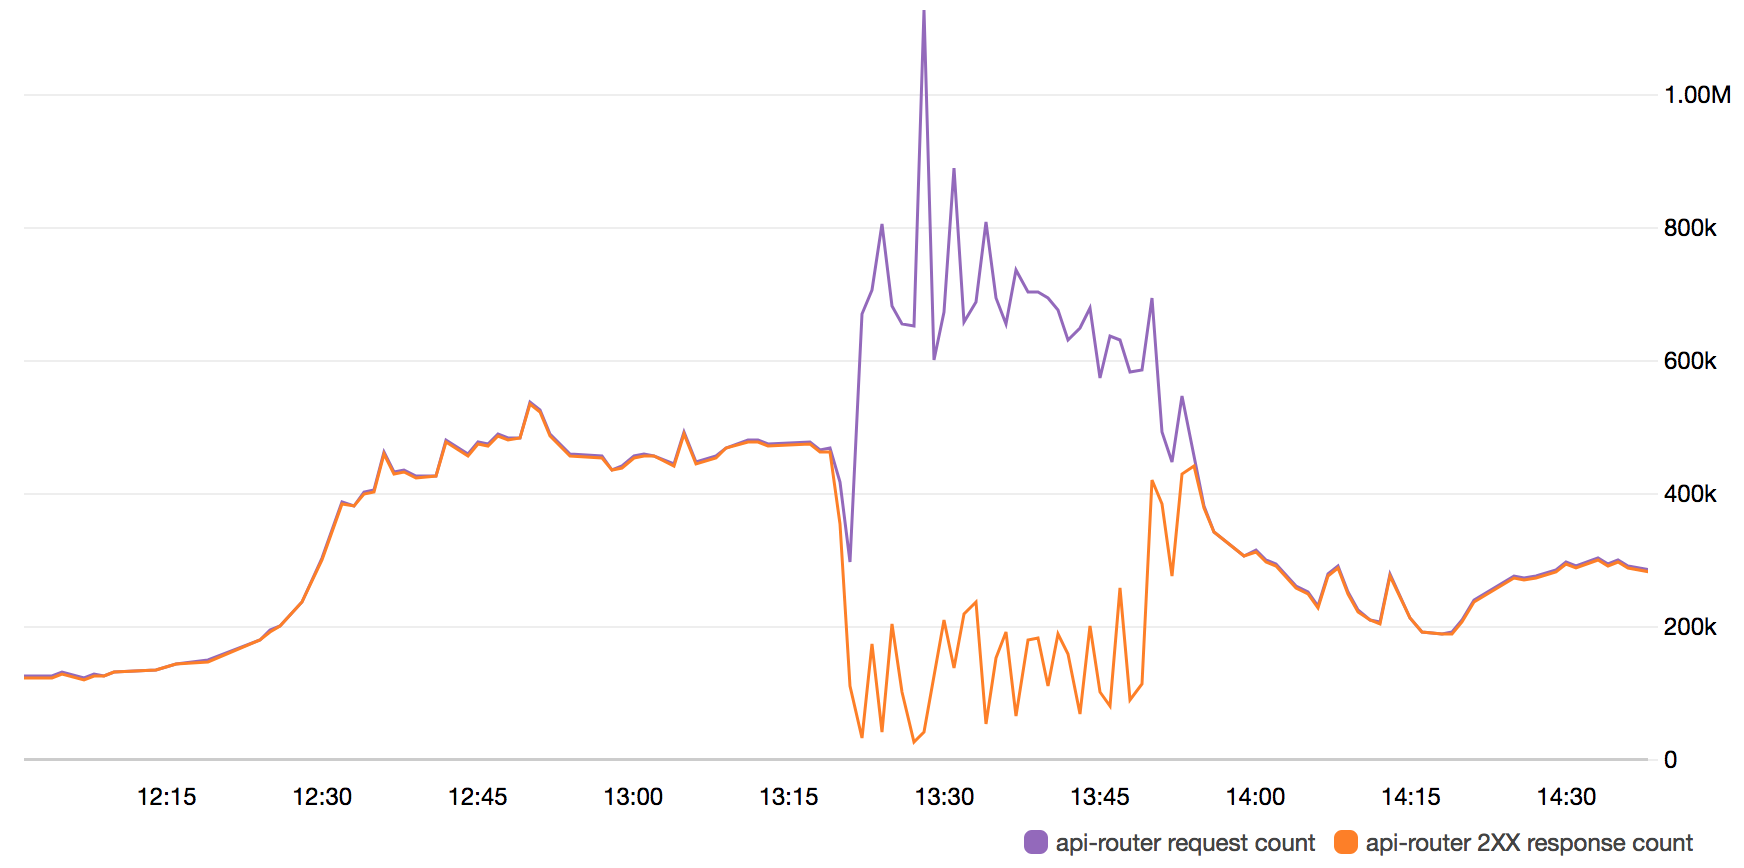 **API Request Count vs. API Requests with HTTP 200 OK response** The high latency of this service that this sudden burst created had a negative cascading effect on the session management component. This component itself then suffered from higher latency, which meant that its health checks would not pass on newly started instances as we scaled up. For approximately 30 minutes from this point, the API service performance was substantially decreased (as can be seen in the orange line in the chart above), albeit still properly serving upwards of 250 000 requests per minute intermittently. At 14:54 CET, the affected service managed to scale to a high enough instance count that it managed to serve all the incoming API traffic in a stable and performant way. The system has been under close monitoring since then but no further issues have been identified. ##Actions Taken Several action points have been identified based on the scenario we experienced yesterday: * **Immediate:** A new internal procedure has been implemented for configuring health checks parameters during high traffic events to allow for services to serve data at a slower (but still reasonable) rate. * **Immediate:** More standardised status page communication templates are being put in place for quicker feedback during service disruptions occurring out of office hours. * **Immediate:** One of the immediate action points are that we will be rolling out over this week is a smarter way of caching and evicting data, which will make the system less prone to experiencing issues when dealing with high traffic volumes on the API at the same time as the underlying data being changed from the Admin UI (resulting caches being evicted). * **Short term:** In parallel to the above, something that has already been in the making for a while (now being fast-tracked) is a reworked API output modelling strategy, which will further increase the performance of the API during these extremely high loads. * **Short term:** Another topic for the near term is to enable smarter caching on the session layer, when the same device is re-connecting with the same UUID and Application Key in a short time span, reducing the stress on that part of the system during high load. * **Short term:** One of the services that experienced issues in the incident yesterday was the component responsible for session creation. There is a new, completely rebuilt internal mechanism for session creation in the works, which are already showing very promising performance results. * **Long term:** In the slightly longer term, we will also be deploying the API in multiple regions, on top of the multiple availability zone (HA) distribution we have in place today. * **Long-term:** We will also be putting in place API rate limiting for certain parts of the system, to ensure a fair distribution of capacity across all customers and, in the end, the end users. This will lessen the risk of the API suffering from being overwhelmed, and will lessen the impact on end users in case of extremely high loads such as the one experienced on Sunday. We want to take this opportunity to apologise for this service disruption and will continue with the highest priority set on addressing the above mentioned action points.
- ResolvedResolved
This incident has been resolved.
- MonitoringMonitoring
Accedo One API response times & error rates are back to normal. We continue monitoring situation.
- IdentifiedIdentified
We are experiencing an elevated level of errors for Accedo One API and are currently looking into the issue.